
Human factors in manufacturing – Part 1

In the first of this two-part series, David Scrimshire explains how to identify human errors in your organisation
We’ve all heard the excuse: “It’s down to human error” with the assumption that there’s nothing we can do about it. However, when we have a non-conformity that can be traced to ‘human error’, ie, a quality issue that was caused by a person doing something incorrectly; there is a deeper root cause of the incident.
There are many factors that can cause a situation where a human error can occur, and these precursors or preconditions are referred to as ‘human factors’.
The study of human factors is about people in their working environments, and it is also about their relationship with equipment and procedures. Just as importantly, it is about their relationships with other people – their co-workers and managers. Its objectives can be seen as safety, efficiency and effectiveness. Human factors answer the question: “Why do smart people sometimes do dangerous and/or stupid things?”
Human errors are caused by human factors
The consideration of human factors first emerged in aviation maintenance, repair and overhaul (MRO) and now it is being applied in many other manufacturing and service sectors.
When an assembly operator is preoccupied with personal problems and fails to perform his/her job requirements properly they may be endangering the lives of those people that use the products they work on.
When a maintenance technician fails to perform his/her duties per the requirements of the job, they are creating the possibility of an accident that can cost human lives. Indeed, human factors have been the cause for some of the most horrific accidents in aviation history.
Combatting human errors requires a systemic approach that ideally prevents their occurrence in the first place or mitigates the severity of their consequences if they happen, and then puts in place a countermeasure to ensure they never reoccur.
Types of situations relating to human error
Hazards are potential occurrences or unsafe conditions, which could, if left unreported and unaddressed, lead to a human error, a near miss and possibly a non‑conformance and/or safety concern.
What could happen – proactive
Events are realised occurrences, which can be notified via a number of existing processes such as customer complaints, CARs, major quality failures, safety alerts, audit non-conformities and accidents.
What has happened – reactive
If we can reduce the number of human errors within the workplace by understanding the human factors that are their root cause(s), the possibility of a serious incident/accident resulting from manufacturing will be diminished proportionally and the cost of poor quality (COPQ) will be reduced.
Commencing the search for human factor root causes
Start the process by agreeing on a clear and concise statement of the event/hazard under consideration. The search for the real root cause of an identified human error can then commence by asking:
- What did the operator not do that they should have done?
- What did the operator do that they shouldn’t have done?
The search then continues by repeatedly asking:
- Why didn’t they do that?
- Why did they do that?
Yes, it’s an application of the ‘5 Whys’ tool, working backwards from the event/hazard (ie, the problem) to the root cause (ie, human factor) – but we can do better.
Directing the search using directed brainstorming
The concept is that when we have an event/hazard that was caused by a person doing something incorrectly, there must be reason for their behaviour. There are many factors that can cause a situation where a human error can occur, some lists include over 300 human factors!
An Ishikawa diagram is an excellent visualisation tool for categorising the potential causes of an event or hazard in order to identify its root cause(s). It prompts teams to brainstorm possible root causes from different perspectives – each perspective is identified by a ‘spoke’ or ‘bone’ of the diagram (this is why it is also referred to as a Fishbone diagram). In essence, it’s directed brainstorming.
Various models have been developed to direct the search for human factors from different perspectives. The more popular models include:
- The PEAR (People, Environment, Actions, Resources) model to characterise human factors
- IAQG’s human factors root causes
- SCMH root cause categories – manufacturing-focused
- The ‘dirty dozen’ human factors – maintenance-focused
- The SHELL model focused on working environments
- The bow-tie model.
Using one or more of these models enables the ‘spokes/bones’ of the Ishikawa diagram to be preformatted to indicate the different perspectives the team needs to consider. An example based on the ‘IAQG’s human factors root causes’ is shown in Figure 1.
Figure 1
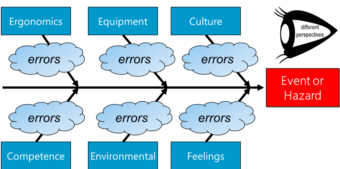
Example of a preformatted Ishikawa diagram based on the
IAQG’s human factors root causes
Guiding team brainstorming sessions
The selected preformatted Ishikawa diagram provides the initial focus for the teams. The team facilitator first selects one of the ‘spokes/bones’ and asks ‘why?’ – which provides the first level of a Why tree. The facilitator continues the search by asking the team:
- Will addressing this (direct) cause prevent the event/hazard?
- If not, can we see the next level of cause?
- If not, what do we suspect as the next level of cause?
- How can we check and confirm the next level of cause?
- Will addressing this level of cause prevent the event/hazard occurring?
If not, the facilitator continues to ask ‘why’ until human factor cause(s) are determined. Attention is then redirected to consider the remaining ‘spokes/bones’.
When searching for the human factor-related ‘root causes’ of complex problems, simple 5 Whys may not be sufficient. The drawback is that an event/hazard can be produced by multiple causes and multiple combinations of causes. Using linear 5 Whys alone works if there is only one cause for every effect identified by the team.
The logical connectivity between events and all their causes can be revealed with a Why Tree Building a Why tree gives the team a much better chance of spotting all the issues that could have been in play prior to the event/hazard occurring. By only asking ‘why questions’ without the Why tree as a guide, the team may never find all the real root cause(s).
Figure 2
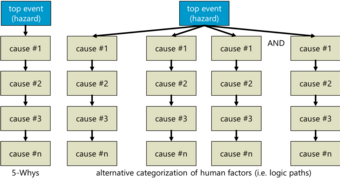
Comparison of simple (linear) 5 Whys with a ‘Why tree’
In this variant, the facilitator again focuses the team on each perspective but allows alternative answers to be presented to the first level why question (four in this illustration). Once all the possible first level causes have been identified, the teams are directed to follow the different ‘logic paths’, until human factor root cause(s) are determined.
A further enhancement may be added in the form of Boolean logic. For example, the team may consider that any of the different ‘logic paths’ are feasible – this equates to an ‘or-gate’. Similarly, an ‘and-gate’ may be identified, which demands that two or more ‘why questions’ must occur simultaneously, and so on.
In situations where the focus is on ‘what the operator did not do that they should have done’, an ‘and-gate’, referred to as the ‘Swiss cheese’ model, can be useful.
Verifying human factor root causes
It is possible, indeed likely, that the use of the Ishikawa diagram and the Why-tree methodology in concert will uncover several root causes. Each of these causes must be scrutinised by the team to elicit the most likely.
The therefore test
One method – favoured by TEC Transnational – is to use the ‘therefore test’ to check the team’s 5 Whys work. The purpose of the ‘therefore test’ is for the facilitator to check the logical flow of the ‘causal chain’ from the earliest point in the sequence up to the event/hazard. After completion of any causal chain, go to the earliest link, reading each statement in turn with the word ‘therefore’ between links as illustrated in Figure 3.
Figure 3
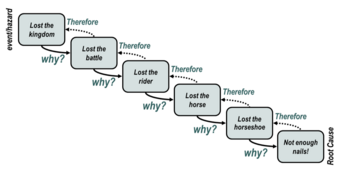
Test the 5 Whys’ ‘stream of logic’ in reverse order and insert the
word ‘therefore’ between each step. If the logic path makes sense in reverse,
then the logic is probably solid.
The team leader starts by reading aloud the statement of the selected root cause, followed by the word ‘therefore’. The team then considers the identified cause immediately before the root cause to test the ‘stream of logic’ in reverse order. This process is continued until the beginning of the 5 Whys causal chain is reached (ie, the first level of the Why tree).
At any point in the process, if the team is not able to insert the word ‘therefore’ and make sense of the analysis, there is a gap in the logic. Whenever gaps are encountered the team will need to fill these gaps with additional facts.
‘Is’ is not structured questioning
Another method of root cause verification returns to the initial statement of the event/hazard, and the team is prompted to ask:
- What is: What’s wrong? (eg, the event/hazard)
- What is not: What logically could be wrong, but is not?
These structured questions may be extended to focus on:
- What parts (were involved)?
- Where (on the part)?
- Where (physical location/department)?
- When (was the problem discovered)?
- How many (parts affected)?
- Who (was the operator/supervisor)?
Frequently, the team will require further information if an answer is not known. The team must then test all possible root causes (human factors) to eliminate causes that do not make sense and possibly assign a percentage contribution to each ‘possible’. The facilitator prompts the team to ask to fill in the blanks:
“if ___________________ is the root cause of ___________________” –
- How does this explain both ‘is’ and ‘is not’?
- Which root cause has the fewest assumptions (%)?
How can we check our assumptions?
Addressing the root cause(s) of events/hazards
With the root cause(s) determined in terms of human factors (ie, why the operator did something incorrectly), attention must be switched to devising ‘controls’ to prevent the cause (preferred) or detect that the cause has happened and mitigate the consequences.
A cross-functional team familiar with the process concerned must investigate ‘controls’ that will either prevent or detect the established root cause(s). Options are frequently found, and the team must first verify that these ‘controls’ will be effective and will not result in any undesirable side-effects and/or cause further problems/events. Cost implications must also be considered.
The chosen controls are then deployed and checked to ensure that either:
- Further reoccurrences don’t happen, or
- Further occurrences will be detected and not released.
Other tools may prove to be useful in this process.
Failure mode and effect analysis
Failure modes and effects analysis (FMEA) is a step-by-step approach for identifying possible failures in the product/service design (DFMEA) or in a manufacturing process (PFMEA), as illustrated in Figure 4.
Figure 4
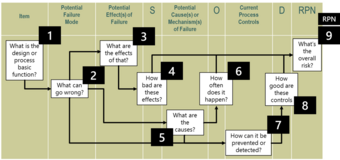
Schematic of an FMEA
The terminology failure mode means the way(s), mode(s), in which something might fail. Failures are any errors or defects, especially ones that affect the customer or downstream operations – they can be potential (hazards) or actual (events).
The terminology ‘effects analysis’ refers to studying the consequences of those failures and determines their severity (inconsequential – catastrophic).
The bow-tie model
The bow-tie model is primarily intended for use by aviation safety managers but may also be applied to manufacturing operations. It ties together previously distinct risk philosophies and tools into a single purpose for that application.
Figure 5
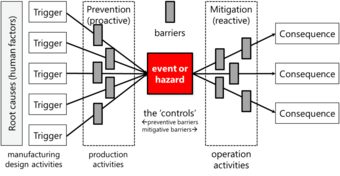
The bow-tie model
Using the bow tie will expose all of these elements in one way or another, and it does so in a single, concise visual chart that resembles a bow tie. The Bow tie relies on four elements to do this, which are:
1. Root causes (human factors) that trigger the
2. Event/hazard that leads to
3. Impacts on manufacturing operations (ie, downstream or the customer); and
4. The relevant risk ‘controls’ (barriers) to the event/hazard and their impact.
The explicit purpose of the bow tie is to show the flow of a safety event including:
- Causes (threats) that aligned to create a problem (ie, Why trees);
The events that funnelled upstream to the event/hazard (ie, the critical point of the event/hazard);
- The cascading events of the event/hazard that lead downstream to impacts that adversely affect the organisation or the product; and
- The failure/success of each risk control measure (equivalent to ‘detection’ in an FMEA) in the sequence of events.
Look out for the second part of this article, where we will explore how to address human errors in your organisation.
About the author: Dr David Scrimshire is Managing Director of TEC Transnational Ltd, a company that specialises in implementing manufacturing and quality systems and train the people who will be operating those systems.
Quality World

Get the latest news, interviews and features on quality in our industry leading magazine.


