Quantifying quality costs in the digital age
Progress indicator
At the CQI’s second Corporate Connect event of 2018, Oakland Consulting demystifies how advanced data analytics can be used to manage quality-related costs.
The quality function plays a vital role in helping organisations measure and manage costs. A challenge for quality professionals in the 21st century is to help organisations better analyse data and link them to business outcomes.
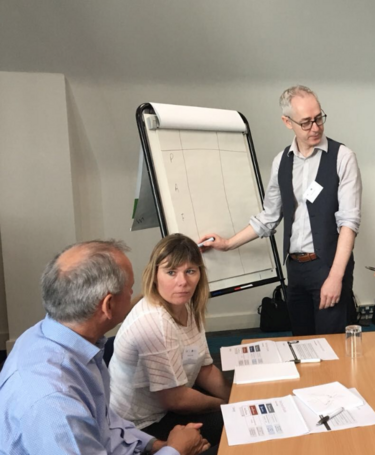
At the ‘The True Cost of Quality’, CQI’s Corporate Connect event on 22 March 2018 at The Hatton in London, UK, Robert Oakland, CQP MCQI, and Richard Corderoy, CQP MCQI, both Partners at Oakland Consulting, explored the challenges and potential benefits of using data as a key management tool.
“Data analysis [provides] ammunition to talk the language of the business,” said Oakland. “We [quality professionals] play an absolutely key role in coaching, mentoring and [driving] fact-based decision-making. It helps us understand the costs of our quality efforts.”
Corderoy said that the application of data gives quality professionals new ways of looking at old school problems. “When we think about AI and data analytics, the first thing that comes to mind is Cambridge Analytica, Facebook and Google adverts – the sinister edge. What seems to get lost is how we can apply these tools to make a business case for quality to the board.”
Recognising the challenges
Attendees said that capturing the total cost of quality was a common struggle across various industries. Finding hidden data, identification of failure, existence of internal silos and misalignment of accountability were among the common challenges they identified.
A study into the costs of quality by Oakland Consulting found that only 50% of product-based organisations measured the costs of reinspecting products and dealing with customer complaints; and 25% of service-based organisations didn’t measure quality failure cost categories.
This reflects a culture of firefighting instead of process control. “Things you expect companies to measure weren’t being measured,” said Oakland.
He highlighted the P-A-F Model as a good way of standardising quality costs. The P-A-F Model is composed of Prevention Costs (costs incurred within supplier management, design in quality and improvement programs to ensure processes are done right the first time), Appraisal Costs (those incurred during inspection, audit and review/pilot to check processes are done right), and Failure Costs (which are classified as internal failures involving rework and regulatory investigations, and external failures involving warranty and customer complaints).
Two main themes were identified during an exercise that used the P-A-F Model to determine typical drivers of quality costs:
- Team behaviour linked to poor quality culture, negative perceptions of quality and lack of interest from leadership.
- Difficulty in identifying the root cause and using data appropriately.
Oakland said that overall, whenever prevention measures increase, quality-related costs fall.
Using advanced analytics in the real world
“The power of data and the way we thought the world works is changing,” said Corderoy. “There is a better way than Excel spreadsheets that allows us to make a more compelling [business case] to the management team.”
He identified six dimensions of quality data: timeliness, validity, consistency, integrity, completeness and accuracy.
“Excel is a great tool for simple analysis, but it can be dangerous if it is used for operational processes,” Corderoy said, adding that a lot of data can be excluded and difficult to verify.
He encouraged the use of the four-stage approach to analytics: think through the problem, check the data exists, do the analysis and implement the outcomes.
“It is really important to have spikey, clear questions,” he said. “How would I coin this problem so I could give it to a child to solve? Can you predict in this sample how many will pass or fail?”
This is also a critical point in machine learning, wherein computer systems are capable of picking up on algorithms without being explicitly programmed. There are two branches of machine learning:
- Supervised: the system is given a data set of work examples. In manufacturing it can be used to predict whether batches are good or bad. Most of the data that quality professionals use with clients falls under this branch.
- Unsupervised: the system clusters and profiles users based on their behaviour. This is how Amazon and Facebook work.
“Data must always be relevant,” Corderoy said. “The harder the question you’re asking, the more data you need.”
When we think about AI and data analytics, the first thing that comes to mind is Cambridge Analytica… What seems to get lost is how we can apply these tools to make a business case for quality to the board
Corderoy used Microsoft Azure as an example of how cloud-computing services can be used as a problem-solving tool to identify root causes and factors. Users of the platform can identify missing values, compare algorithms, create a boosted decision tree, determine which of their data sets has the most impact on business and capture false positives.
“This is the holy grail of statistical process control,” he said, adding that it can measure huge areas of operational performance, production in factories, the service in services firms, and spot customers about to leave based on their behaviour, or identify key talent.
Value from the talk
“Measuring and managing quality-related cost is a challenge for quality professionals. It was great to see the corporate partner community considering and sharing how to approach this. And importantly, the opportunities presented by technology,” said CQI CEO Vincent Desmond.
“Technology is coming whether we like it or not. We have a choice which is to understand and embrace our position in the digital world or get left behind. We have the potential to make a great contribution to make sure the application of technology is effective in using our tool set.”
A key takeaway for attendee Robert Ayres, Programme Quality Manager at Tideway, was the application of the P-A-F Model. “The use of the P-A-F Model is something that we need to implement more rigorously in our work.”
For participant Cecilia Suarez-Lledo, Quality and CPI Manager at Fluor, what resonated was the “important role of data, capturing data and demonstrating the impact of quality in the business – the value and savings [that can be made].”
A key lesson for CQI Chair Ian Mitchell, CQP FCQI, was the potential applications for “predicting when projects go awry”. What surprised me the most was “the machine learning. I can’t stop thinking about the applications for CQI memberships,” he said.
More on machine learning
This quick demonstration, similar to one performed at the Corporate Connect event, shows how the cloud-based app Azure can be used to create predictive maintenance.
Quality World

Get the latest news, interviews and features on quality in our industry leading magazine.


